It’s Sunday. You’ve just had a couple beers too much the night before. Waking up at 2pm and in dire need for a juicy pizza. You open your phone, place an order on any of your gazillion apps. 20 minutes later, your door rings and a guy in way too big company-themed jacket and cap hands you your food. We’ve all been there.
Food delivery has become an integral part of our lives. One third of all Americans say that they order food online at least twice per week. By 2023, the worldwide market for online food delivery is projected to hit $137 billion.
In this article, we will closely examine the ins and outs of food delivery as a business model. How did it came to be? What are the pros and cons? How do you measure success in such a competitive market? These are some of the many questions that we will try to answer.
Definition
Food delivery is a courier service in which stores, restaurants, or third-party applications delivers food to consumers on demand. These days, orders are executed through mobile apps, websites or via telephone.
Deliveries include cooked dishes as well as groceries from supermarkets. Other methods of food delivery include catering or wholesale.
The first recorded instance of a meal delivery comes from Italy in 1889. King Umberto and his Queen Margherita and called Raffaele Esposito, the creator of the Pizza Margherita, to deliver a pizza to their palace in Naples.
The rise of the modern-day food delivery system was caused by economic necessity. During the 1950’s, the growing American middle class was stuck to their homes, watching TV all day. This almost caused a collapse in the American restaurant industry and as a result had them adapt by creating the modern-day delivery services we all know. Reports from that time indicate that this adaptation boosted restaurant sales by over 50 percent in a short period of time.
Today, the market for food delivery is valued at $122 billion. This is equal to 1 percent of the global food market or 4 percent of the food sold through restaurants. While many markets have already matured and identified companies to take on market leadership, the overall demand for food delivery is still increasing at a yearly rate of 3.5 percent.
Food Delivery Business Model Examples
Food delivery businesses come in many shapes and forms. They range from platform that partner up with restaurants and drivers to a fully integrated model where everything is kept in-house.
Platform To Consumer Model
In the Platform To Consumer Model, third-party apps are listing available restaurants close to the customer’s proximity, normally through a website or a mobile app.
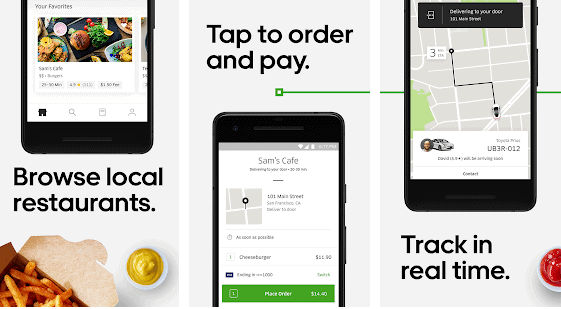
Consumers can then order from these partner restaurants and have the food delivered either by the restaurant or a driver of the platform. Prominent examples include the likes of DoorDash, UberEats or Deliveroo.
Normally, the platform takes a 20 to 30 percent cut from the order value on top potential delivery cost that may arise.
The Platform To Consumer model currently represents the dominant mode of food delivery. It accounts for 63 out of the $122 billion that are generated in sales per year.
Delivery Service Aggregators
Although they technically fall under the Platform to Consumer umbrella, it is worth mentioning them separately. In the aggregator model, the platform works acts as an intermediate between a customer and numerous local restaurants.
Furthermore, they provide customer support on behalf of these restaurants in case there are problems with deliveries or the order itself.
Again, a fixed or variable fee is applied for every successful transaction facilitated through the platform. Examples include the likes of JustEat, Delivery Hero or GrubHub.
Some have recently experiment with different subscription models in which customers pay a monthly fee in exchange for free delivery and other discounts.
Full-Stack Model
In the Full-Stack Model, the food delivery business does everything in-house. This includes not only building the app or hiring drivers, but also cooking the food.
Oftentimes, the food is prepared in so-called ghost or cloud kitchens. People cannot dine in these facilities as the primary purpose is to prepare food that is delivered. These cloud kitchens often allow allocating the creation of food in cheaper areas while only renting out space for the kitchen.
One of the major drawbacks of this model is the fact that substantial investments are required to launch the platform. On the other hand, once sufficient scale is achieved, full-stack food delivery platforms tend to earn more as they control the whole value chain. They furthermore can do better quality control of their food as everything is cooked in-house.
Restaurant To Consumer Model
In the Restaurant To Consumer Model, the restaurant started out serving food via its own locations. The most famous examples include the likes of McDonalds, Burger King or Domino’s.
To modernize, these companies went on to offer food deliveries via their websites, app or join a delivery platform. For instance, McDonalds operates its own food delivery network in selected countries via its own app. Furthermore, it partners up with the likes of DoorDash to deliver food to regions they don’t serve themselves.
Domino’s became a poster child in leading the food delivery movement. Some of the company’s innovations in the space include:
- A voice recognition system (named Dom) to place orders
- An app to track delivery on route
- Experimenting with drones for automated delivery
… and many more. These initiatives certainly panned out well for the pizza franchise. By 2017, Domino’s overtook Pizza Hut as the world’s most valuable pizza chain. Furthermore, the company’s share price jumped from $11 in 2010 to over $351 in 2020.
Food Delivery Business Model – Pros and Cons
While food delivery applications are hard to build and even harder to execute, they possess a tremendous amount of potential.
According to Crunchbase, food delivery startups have raised a combined total of $15 billion in over 800 rounds of venture capital funding. Many went on to become integral parts of our daily routines.
With that in mind, let’s look at some of the pros and cons of operating a food delivery business.
Food Delivery Business Model – Advantages
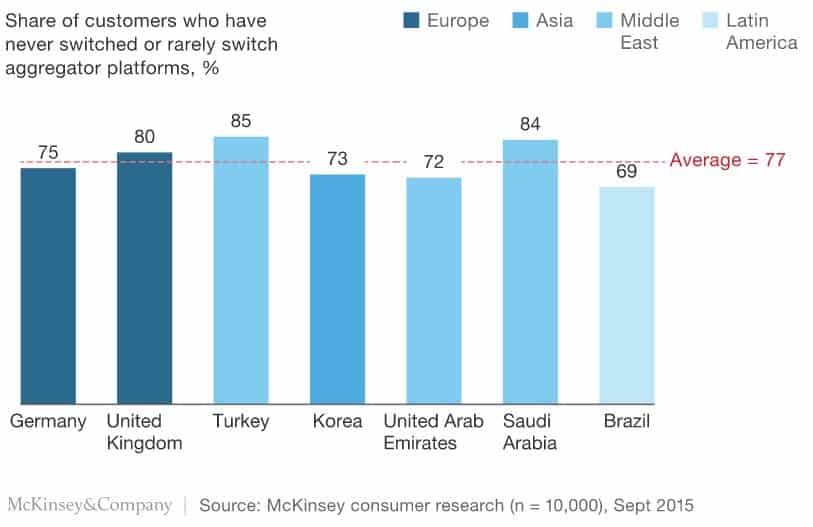
Product stickiness. Once customers become acquainted with a platform, they rarely switch to a new app. Research by McKinsey shows that 77 percent of customers rarely switch platforms. But: the higher competition is in a country, the more often customers tend to experiment with new services.
Network effects. Since product delivery platforms are a, in a bigger sense, marketplaces that connect buyers with suppliers, they end up benefiting from network effect once sufficient scale is hit. While networks are hard to build, they are even harder to replicate. This yields substantial benefits for those who are able to build a big enough business.
Supply prioritization. As a food marketplace, your business can decide which restaurants and suppliers it would like to promote. This allows you to push products with higher margins and good customer ratings.
Pricing monopoly. Next to prioritizing supply, food delivery businesses can also set prices and commission at will once they’ve hit sufficient scale. There is plenty of examples where quasi-monopolies raised fees right after acquiring their last competitors. Since restaurants are dependent upon those apps for receiving orders, they have no choice but to comply with any change.
No legal commitment to drivers. While ethically questionable, drivers are generally not employed by food delivery businesses, but rather work on a contractual basis. This greatly minimizes operational costs as they only get paid when executing jobs. Furthermore, there is no requirement to pay medical insurance or allow for paid vacation.
Food Delivery Business Model – Disadvantages
High operating cost. DoorDash supposedly lost $400 million in 2019 while Postmates had to lay off dozens of employees and close some offices. Those are just two examples of food delivery businesses that had to pay the price for their massive operating cost and thin margins. Companies that operate under the full-stack model suffer from this especially since everything is kept in-house.
Operational complexity. Developing the app, finding suitable restaurants and drivers, equipping them with necessary equipment, or optimizing delivery routes are just some of the many problems food delivery businesses have to invest in. Perfectively running such a business is not only extremely costly, but a highly complex task involving many parts to be running perfectly.
Fierce competition. There’s a total of 572 food delivery businesses – in the US alone. With venture capital funding being at an all-time high, it’s never been easier to start. Furthermore, they compete against other restaurants and the customer’s willingness to cook from home.
Essential Metrics & KPIs
Food delivery is a multi-layered process that involves several parties. As such, it is advisable to track the performance of each of those parties involved.
To recap, these include the operator of the platform, restaurants, drivers, as well as customers. Let’s look at them in more detail.
Platform KPIs
To assess how mature the business as a whole has become as well as showing positive developments to investors and key stakeholders, it is important to track company-wide platform KPIs. These span over multiple stakeholders and indicate the overall success of the business.
Total Amount Of Orders
Next to the money you’re generating, knowing how much orders you are receiving is the most important metric when assessing how a food delivery business is growing.
In the venture capital world, investors often strive for growth and the amount of orders is one of the metrics to show that. Generally speaking, very early stage food delivery businesses are expected to double the amount of orders they fulfill every month.
Mature businesses such as GrubHub grow much more conservative, with a rate of around 20 to 30 percent per quarter.
Average Number Of Deliveries/Orders Per Hour
The Average Number Of Deliveries/Orders Per Hour demonstrates whether a business has achieved sufficient density to realize sustainable unit economics (i.e. positive contribution margins).
Consequently, the higher the number of deliveries and orders per hour becomes, the more indicative it becomes how much scale a platform has achieved.
To calculate it, simply the total amount of orders and/or deliveries per hour over a given timeframe (e.g. week, month, or quarter) and divide by the amount of hours chosen.
Let’s assume we want to compute the average number of deliveries for one day. In our example we fulfilled 2000 orders for that day, with a day being 24 hours. That would yield an average of 2000 ÷ 24 = 83.3 deliveries per hour.
The calculation can also be broken down over a bigger timespan. For instance, we can get the total amount of orders for one week for 1 to 2pm and divide it by the amount of days (= 7) to receive the average amount of orders we receive between 1 to 2pm.
Average Profit Per Delivery
Every business has to eventually turn a profit and despite their gigantic funding rounds, food delivery businesses are no exception to this norm.
As such, knowing how much profit you make on every delivery is crucial and helps weed out the profitable restaurants and delivery routes from the bad performing ones.
Depending on how the corporation is structured, expenses such as marketing, payroll, or cost of operations have to be accounted for as well.
Driver & Restaurant KPIs
Drivers and restaurants are the parts of your business that make the food and execute the order, hence their importance cannot be overstated.
Perfecting the whole delivery chain is a highly complex operational problem and requires optimization on many ends. The following metrics allow us to do just that.
Average Order Duration
The Average Order Duration serves as an indicator as to how fast your business can fulfill a customer’s order. An order takes place from the moment a customer places purchases a meal on the app to the point when he sends the confirmation that he/she received it.
To calculate your Average Order Duration, you sum up the time it takes to deliver orders in a given timeframe and divide it by the amount of orders fulfilled.
Average Order Duration = Sum Of Delivery Time ÷ Total Amount Of Orders
If it took your business a total of 2000 minutes to deliver 100 orders, then your average order duration is 20 minutes per order. Consequently, the goal I to minimize order duration.
The order duration can be furthermore broken down into the time it takes both the restaurant and driver to fulfill an order. Those metrics can then be compared to other restaurants/drivers to weed out the slow performers.
Knowing, for instance, how much it takes an average pizza store to cook an order can help you in the assessment process when onboarding new restaurants.
Percentage of Driver Is On Order / Idle
Measuring the percentage of drivers that are currently either occupied with a delivery or waiting for another allows a food delivery app to assess how efficient their driver network operates.
Hereby, the business can assess which time of the day has the highest demand and as such determine how many drivers must be active throughout each period of the day.
Percentage of drivers that are on order vs. idle can be calculated by taking the total amount of currently active drivers and dividing it by the amount of drivers executing or waiting for an order.
Percentage Driver On Order = (Driver On Order ÷ Total Active Drivers) x 100
Percentage Driver On Idle = (Driver On Idle ÷ Total Active Drivers) x 100
The goal is to maximize the amount of drivers on order and minimize the drivers that are waiting for one.
The calculation is especially important for delivery businesses that follow the full-stack model as drivers are often employed by the company (and not working on a contractual basis).
Number Of Support Tickets
Support tickets are incidents that require the platform’s help to resolve outstanding issues. Examples include disputes such as incorrect or damaged deliveries, wrong ingredients, or missing items.
First and foremost, we can track the amount of outstanding as well as closed support tickets. Furthermore, we can analyze the speed at which we are able to resolve these issues.
This can be done across the whole business as well as on the restaurant level. As such, we can identify restaurants that tend to cause unacceptable amounts of support tickets. This information can be used to either downrank them on the platform or discontinue the relationship altogether.
Customer KPIs
Last but not least, it is crucial to know how much we make from our customers, how much we can spend to acquire them, as well as how happy they are with the service. Hence, the following metrics are crucial to keep an eye on.
Churn Rate
Churn Rate (also called Customer Churn) refers to the rate at which you lose customers for a given timeframe (i.e. monthly, quarterly, or annually).
The Churn Rate is calculated as follows:
Churn Rate = (Users At Beginning Of Period – Users At End Of Period) ÷ Users At Beginning Of Period
Let’s say your food delivery startup has 250,000 users at the beginning and 230,000 customers at the end of the month, then your Churn Rate is equal to (250,000 – 230,000) ÷ 250,000 = 8 percent.
Churn Rates tend to fluctuate quite heavily, especially in the food delivery business. Studies show that over 86 percent of newly acquired customers will stop using a service within two weeks of the launch. The high churn is a result of the low entry barriers in creating a food delivery app as well as the intense amount of competition in the space.
There are many factors that influence the retention of customers, including:
- Seamlessness of user experience
- Level of customer service
- Stickiness of the product
- Available supply (i.e. restaurants and drivers) and consequently quality of food offering
- Speed of delivery
Customer Lifetime Value (CLV)
Customer Lifetime Value (CLV) tells you how much revenue, on average, you a generating from a user over the course of their membership. The longer a customer is using the app and/or the more they spend, the higher their lifetime value will be.
Knowing how much you make from a customer over the course of their usage can allow you to assess how much money you can spend on acquiring them (more on that later on).
The formula for calculating CLV looks as follows:
CLV = ARPA ÷ Churn Rate
ARPA represents your average revenue per account for a given period (e.g. monthly). It is calculated by dividing the revenue for the chosen period by the number of customers in that same timeframe.
For instance, if the average revenue per account/customer each month is $10, and the percentage of customers that do not return is 20% (= Churn Rate), then CLV is equal to $50.
Next to knowing how much you can spend on acquiring a customer, CLV also indicates what kind of products customers with the highest CLV desire, which product types generate the highest revenue as well as who your most profitable customers are.
Net Promoter Score (NPS)
Net Promoter Score (NPS) is a direct measure of how much value your customers are gaining from using your product.
The result of calculating NPS gives a proxy about how likely your customers are to recommend your business to someone else. It is measured on a scale from 0 to 10 with 0 being no recommendation while 10 indicates they absolutely would endorse your app.
NPS is separated into three distinctive categories, including:
- Detractors (customers giving a score of 0 – 6)
- Passives (customers giving a score of 7 or 8)
- Promoters (customers giving a score of 9 or 10)
The score is calculated by subtracting the percentage of detractors from the percentage of promoters.
NPS = % Promoters – % Detractors
The calculation should result in a score between -100 and +100. For instance, if your survey yields 60 percent promoters, 20 percent passives and detractors respectively, then your NPS would be equal to 60% – 20% = 40. It is advised to measure NPS as often as possible. This allows you to assess how customer satisfaction evolves over time while allowing your business to proactively react to any negativ