Amazon, eBay, Airbnb, or Uber are just a few of many companies operating as an online marketplace. Customers love them for their abundance of choice and shopping convenience.
What you may not know is that these examples (as well as many other marketplaces) have become some of the biggest and most valuable companies in the world.
This article will shed some light into what constitutes an online marketplace, the different types, pros and cons, as well as how to track their success.
Online Marketplace Definition
Online marketplaces connect buyers and sellers on a proprietary and centralized platform. Oftentimes, the marketplace operator does not hold any type of inventory, but helps the buyers and sellers to facilitate a transaction.
His or her duties may include tasks such as handling logistics or facilitating the payment. Sellers can then focus on their core competency, that is providing customers with the most relevant products and services.
Marketplaces come in many shapes or forms, but are often separated between two categories: horizontal or vertical.
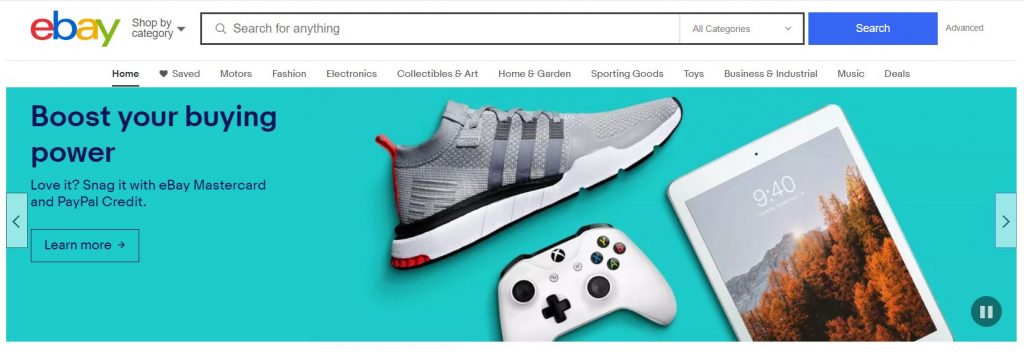
Horizontal marketplaces offer products across different categories with a similar level of service. For instance, customers can buy products on eBay ranging from clothing to electronics.
On the other hand, vertical marketplaces focus on one product category, but offers many services attached to it. For instance, rare sneaker marketplace StockX handles aspects such as authentication and quality checks of the product, payment process, or the transportation. It allows them to serve as a trusted source for interested customers.
The Chicken And Egg Problem Of Marketplaces
Marketplaces are built on the premise of buyers and sellers transacting with each other. But when you start, you have none of those. So how do you convince sellers to join a platform without buyers and vice versa?
This problem is referred to as the chicken and egg problem of online marketplaces. Similar to the debate of whether the chicken or egg came first, marketplace enthusiasts face the challenge of figuring out which side to build first.
The more sellers you can attract, the greater value you can provide to your customers. Higher value leads to more buyers, which in turn increase the value for sellers.
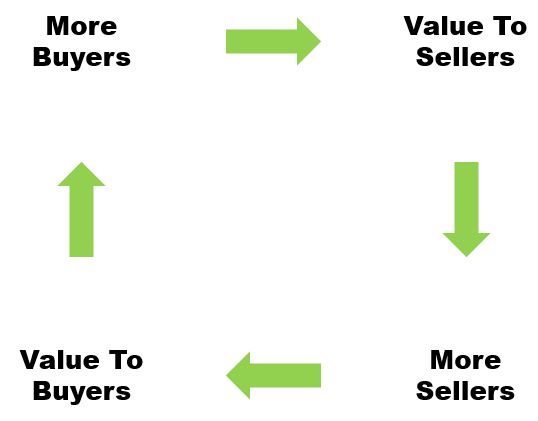
So whether you attract buyers or sellers first (or even simultaneously), there’s a few tactics you can employ in order to make your marketplace more attractive.
Tactics To Attract Buyers
Monetary incentives. You can give customers rewards for joining or making purchases on your platform. For instance, a sign-up comes with a 10$ gift card or 10 percent discount on baskets above a certain threshold.
Act as producer. Some marketplaces such as Lazada have begun their marketplace journey by selling their own products first and only then attracting sellers. That way you can make sure to give customers the best buying experience. Supplier can then join a platform with a proven and active customer base.
Have an appealing mission. Other marketplaces have started with a great market-oriented mission to solve a pressing problem. The bigger your customer pain is, the easier it will be for you to attract customers.
For instance, Uber and Lyft solved many of the problems plaguing the taxi experience. These ranged from delayed cabs to dangerous and hostile drivers. These businesses created a safer and more convenient way of booking a ride, and as such had customers sign up immediately. Hence, Lyft’s mission is to “improve people’s lives with the world’s best transportation.”
Tactics To Attract Sellers
Make it simple. The easier it is for a merchant to sell on your platform, the likelier are they going to figure out this process and start selling. Said convenience also decreases the cost and time spend for setting up a shop, which in turn encourages more people to sell.
Seller programs. Create dedicated seller programs (e.g. through online courses or assigned key account managers) to show sellers the possibilities of your platform. The more people are educated about your product, the likelier are they engaging with it.
Marketplace Business Model Examples
Marketplaces come in many shapes and forms. While most people probably think of online e-commerce companies such as Amazon or eBay, it certainly isn’t the only area and industry of application.
These are the five different types of marketplaces we see nowadays:
- Commission Model
- Subscription Model
- Freemium Model
- Listing Model
- Featured Ad Placement
Commission Model
Probably the most widespread form of marketplace approaches in which a commission is charged on each successful transaction. The platform operator then imposes either a fixed or variable fee on the product or service being transacted.
The operator of the platform normally handles the payment and logistics aspects of it while sellers focus on providing high-quality products or services. A key aspect of this model is that anyone (both buyers and sellers) can join the platform for free. The marketplace operator then benefits from all the value creation occurring on the platform.
Examples include companies such as Amazon, eBay, Etsy, or Airbnb. All of these companies charge a commission per transaction and have sellers offering various products on their platform.
Subscription Model
In the subscription revenue model, either or both buyers and sellers are charged a reoccurring fee to access the marketplace. The selling point for customers is that they gain access to a great experience or can simply save money. Sellers, on the other hand, can acquire customers that are likelier to spend money.
The biggest challenge in charging a reoccurring subscription is that the platform has to become valuable enough so that both customers and sellers gain enough benefits from using it. You’d need enough users to convince sellers to pay. And potential customers won’t sign up if they don’t see immediate benefits by joining you.
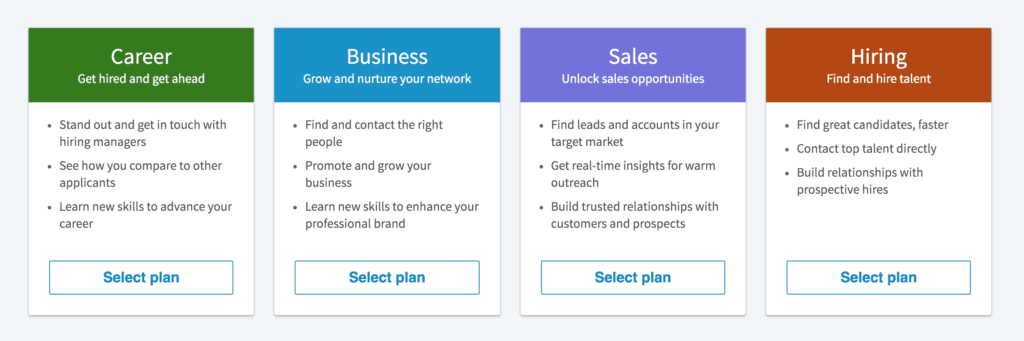
One example of a successful marketplace is LinkedIn’s B2B solutions. Here, recruiting companies pay a monthly fee to be able to access the platform and get in contact with potential employees. Conversely, customers (in that case employees) can also gain access to LinkedIn’s premium subscription. It allows them to directly get in contact with others or access its learning platform for free.
Freemium Model
Within the freemium model, the marketplace can be used free of charge for both buyers and sellers. Monetization occurs by offering additional features, premium subscriptions, or by cross-selling other services.
The thinking behind this model is that your free platform gets the users hooked, which doesn’t leave him or her a choice but to buy your premium features. The challenge is to find the right balance between your free and premium features, so that people don’t leave you immediately.
A great example is stock photo provider Unsplash. Photos are offered by the sellers while users can access a subset of them for free. If they want to have complete access to all available stock images, they pay a monthly subscription fee or compensate the photographer directly.
Listing Model
In the listing model, sellers are charged for every offer they upload on the platform. This model is utilized when sellers list high-ticket items such as cars or houses. Since resources are scarce, sellers profit from having more of them listed.
Furthermore, the purchasing transaction oftentimes does not occur on the platform, but after meeting with the seller and seeing the listed object. Therefore, listing marketplace normally don’t facilitate the transaction (in terms of payment processing) due to the complexity of the item listed.
The biggest selling point of listing marketplaces is the fact that they drive a lot of traffic to the platform, and as such, allow providers to gain more visibility on their listings.
One of the challenges of this model is to price the listing fee accordingly. If it is to high, sellers will stay away from listing on the platform.
Furthermore, these sites have to be able to drive high volumes of traffic to justify their listing fees. Therefore, they are often at the mercy of Google’s algorithm to show them on top for any given search query.
Examples of this business model include websites such as Trulia.com or Realtor.com.
Featured Ad Placement
Featured ads are oftentimes part of other marketplaces such as the commission or listing models. In this scenario, a seller can opt in to pay an additional fee to have their listing displayed before others.
Again, the main challenge is to drive enough visitors to the site so that sellers are willing to pay for these ads.
One example of a company utilizing this is the classifieds division of eBay. Listing and selling on their platform is free, but users pay a flat fee if they want their offering to be displayed first.
Marketplace Business Model – Pros and Cons
Marketplace models are very complex to build and operate, but once scale is achieved, can create many benefits for their operator.
The following chapter lists the many pros and cons of operating an online marketplace.
Marketplace Business Model – Advantages
Network effects. Once there are enough buyers and sellers on the platform, the marketplace can grow through the strength of its own network. Whether it’s buyers recommending the platform to their friends or users providing engaging feedback – if your platform is engaging and beneficial to the intended customer demographic, new users will come in automatically.
Defensibility. Once the network is built, users will most likely stick to the platform. If competitors want to overtake you, they’d not only need a better product and brand, but also build a similar sized network. This is both very costly and time consuming. As such, established marketplaces are hard to dethrone from their premier position.
Just take Craigslist, for instance. Even after over 20 years of being in business, it has not bothered with updating its user interface nor adding the necessary safety measures for customers to transact on the platform. This is because the nodes on its network are so strong that encourages people to come back despite a presumably poor user experience as well as risks of being mugged or even killed.
High user engagement. Marketplaces focusing on repeated purchases (e.g. Poshmark) oftentimes have high engaging users. As the marketplace facilitates communication and discovery, customers may get intrigued to find the best deals or simply browse the stores. On the other hand, sellers want to get ahead of their competition and therefore study the marketplace extensively.
High margins. If a marketplace becomes the dominant player in its segment (and thus has to spend less on marketing), the profit margins on each transactions can become very high. When buyers get to know you as the go-to destination for their shopping needs, your spend to motivate them shopping greatly decreases.
Pricing monopoly. While ethically questionable, dominant marketplaces have the ability to dictate the commissions and fees they charge. Since being on the platform is so lucrative for sellers, they are often charged more over time. If there is no comparable marketplace around, sellers often have to swallow those rate increases.
Data creation. Marketplaces generate a lot of (consumer) data, which operators can use to either sell or take advantage off by setting foot in a new industry. Amazon, for instance, analyzes its sellers data and can then sell it under its own branded Amazon Basic brand. Oftentimes, sellers are left behind as the company’s own products are favored.
Marketplace Business Model – Disadvantages
High set up cost. Building the necessary technology stack, advertising to attract buyers and suppliers, and hiring the right employees are just some of the costly activities involved in setting up a marketplace. It may take a substantial amount of investment and time to build up a sizeable revenue side.
Dependence on other platforms. Some marketplaces are characterized by fewer purchase frequency (e.g. house or car listings), thus having a harder time to build a brand. They therefore you to keep advertising on platforms such as Google or Facebook to be found by customers. The few touchpoints make it a lot harder to build a brand through repeated interactions.
Many competitors. Because the marketplace model can be financially lucrative, competition is often very intense. While setting up a marketplace may be costly, more and more investors are willing to pour in the financial resources to help startups compete.
Varying seller quality. Sellers and the quality of products or services they offer may vary greatly. This may become especially problematic when sellers are also responsible for aspects such as delivery. Marketplace operators have to account for that and invest in their seller side. That involves duties such as authenticating products and sellers or building a logistics network to facilitate transportation.
Network pollution. Network pollution refers to marketplace participants, whether it’s buyers or sellers, who try to game the system for their own gain. For example, on fashion marketplace Depop, sellers would offer fake products. On cashback platform ShopBack, buyers have repeatedly made ‘fake’ purchases (which they would cancel later on) in hopes of pocketing those rewards.
As such, some marketplaces have to invest millions of dollars in vetting their content or authenticating products and services. One of the most prominent examples is the previously mentioned StockX, which employs its own team of trained authenticators. Other means of vetting include features like user reviews or working directly together with sellers.
Marketplace Metrics & KPIs
Marketplaces come in many shapes and forms. Companies may focus on other businesses (B2B) or private consumers (B2C), operate locally or globally and are integrated either horizontally or vertically.
So how do you as a founder know if you’re on the right? One part of the solution is tracking a few key metrics to assess your growth. These include:
- Gross Merchandise Value (GMV)
- Rake (Take Rate)
- Net Revenue
- Average Order Value (AOV)
- Gross & Contribution Margin
- Liquidity
- Customer Acquisition Cost (CAC)
- Repeat Purchase Rate (RPR)
- Net Promoter Score (NPS)
Gross Merchandise Value
GMV gives you the total of the goods and services transacted. It is calculated by multiplying the average value of the order by the number of sales.
GMV = Average Order Value x Total Sales
So if your platform facilitates one million sales with an average value of 5 USD, then your GMV is $5 million. If you want to get a more accurate representation of your GMV, you have to calculate it after subtracting cancelations and returns. You therefore calculate based on delivered goods rather than bookings.
Rake (Take Rate)
The Take Rate is the metric that compliments GMV and helps us understand how healthy the marketplace operates. As the name indicates, the take rate shows how much the business takes home from every transaction.
It is the revenue from the commissions and fees (or other income streams) divided by the total amount of sales.
Rake = (Commission + Fees) ÷ Total Sales
If a marketplace sells 10,000 goods in a given period and earns 500 USD in each commissions and fees, then the Take Rate is (1000 + 1000) ÷ 10,000 = 10 percent. So the business obtains 20 percent of every transactions conducted on the platform.
Take Rates often vary greatly, depending on the type of goods transacted and the value your marketplace provides. For instance, digital freelance platform Fiverr charges 5 to 20 percent on every transaction. On the other hand, eBay charges a maximum of 12 percent on its marketplace.
Net Revenue
Net revenue represents the actual revenue the marketplace generates in a given period. It is calculated by multiplying GMV with the Take Rate.
Net Revenue = GMV x Take Rate
So if we stick to the results of our previous examples, we receive a net revenue of $5 million x 20 percent = $1 million.
Average Order Value
Similar to net revenue, the average order value helps us understand how much the company earns – in this case on the transaction level. AOV results by dividing the total value of transactions by the amount of sales on the platform.
AOV = Total Transaction Value ÷ Total Sales
So if you sell goods worth $10 million and your total sales amount to one million, then the average value of a transaction is $10.
AOV helps us to understand how competitors are performing by comparing their AOV to yours. Furthermore, we can assess how hard it will be to attract buyers to the marketplace. The higher a good or service is priced, the fewer customers are potentially willing to spend.
Gross & Contribution Margin
The gross margin is a company’s net revenue subtracted by the cost of selling goods (COGS). While it gives us a good indication of how profitable we are, businesses should use the contribution margin for a more detailed view.
To calculate the contribution margin, we not only subtract COGS, but other variable cost such as customer service, research, hiring employees and so forth. The contribution margin is one of the best indicators to assess how profitable the marketplace is overall.
Liquidity
Liquidity is what keeps the engine that is our marketplace running. It indicates how active the marketplace is at any given moment in time. For liquidity, we look at measures such as:
- Amount of buyers and sellers registered on the platform
- Number of listings
- Number of purchases and returns
- Geographic diversity (in how many different locations we sell)
This list is not exclusive and should be adapted to the specifics of each marketplace model and industry.
As a marketplace business, our goal is to maximize liquidity. The more possibilities for transaction we offer to our customers, the likelier they are to engage with the product.
Customer Acquisition Cost
Our CAC tells us how expensive it is for our business to acquire both buyers and sellers to the platform. It is calculated by summarizing the cost for marketing and sales and divide that by the total amount of new customers.
CAC = Sales & Marketing Costs ÷ New Customers
So if we spend $2,000 on Facebook ads and that yields us 100 new customers, our CAC is $2,000 ÷ 100 new customers = 20 $ per new customer.
One important distinction has to be made between CAC for buyers and sellers on the marketplace. Oftentimes, different marketing channels are utilized to build these two sides.
Your goal is to minimize CAC. The more you spend to acquire a customer or seller, the more value he or she has to generate on the platform to break even.
Repeat Purchase Rate
Acquiring new customers is expensive. So best case, you want to sell to the ones who are already registered on your platform.
As opposed to paying for ads, you can use more cost-effective marketing solutions such as email or push notifications. And you can do this once the user is already in your ecosystem.
The repeat purchase rate gives you the percentage of your existing customer base that purchased for a second time. It is therefore calculated by dividing the total number of customers by the number of customers you had two transactions or more.
RPR = No. Of Customers With > 1 Purchase ÷ Total Number Of Customers
You should do that calculation on a periodic basis, i.e. for a given year or month. Let’s say you have 50,000 customers with at least two transactions and a total of 1 million buyers on the platform. Then your RPR is equal to 50,000 ÷ 1,000,000 = 5 percent.
You can also measure this rate on your supplier side, for instance how repeatedly sellers upload listings on the platform.
The higher this percentage, the more you can spend on acquiring new customers. This is best achieved in an industry with many repeat purchases. Examples include books taxi rides (e.g. Uber and Lyft). On the other hand, a platform selling used cars would have to create a lot more revenue as purchases are very infrequent.
Net Promoter Score
Another important metric to measure customer satisfaction and retention is using NPS. The score is obtained by asking the question of “on a scale of 0 to 10, how likely are you to recommend to a friend?”.
Depending on the score that is given to the question, three categories of people can be defined:
- Promoters = score of 9 or 10 given
- Passives = score of 8 or 7 given
- Detractors = score of 0 to 7 given
NPS is then calculated as the difference between the percentage of promoters (customers who would recommend you) and detractors (customers who wouldn’t recommend you).
NPS = % Promoters – % Detractors
For instance, if you have 35% promoters, 50% passives and 15% detractors, NPS will be +20. A NPS score above 50 is considered excellent.
One of the important aspects of NPS is to measure it frequently to see how satisfied your customers are over time.